
Platform
Locations
Insights and Resources
News
About
Connect
Client Portal
XThis report provides market context for organizations evaluating Miami and the broader Miami-Dade County area as a location for data center operations. It covers Miami’s unique role as a global connectivity gateway, supply and demand dynamics, power infrastructure, the regulatory environment, and tax considerations — drawing on current third-party research, local reporting, and publicly available market data.

Miami occupies a category of its own among U.S. data center markets. It is not a hyperscale corridor competing with Northern Virginia or Phoenix on megawatts and campus acreage. Miami’s defining characteristic is its role as the Western Hemisphere’s primary digital gateway — the city where more than 97% of internet traffic flowing between North America, Latin America, and the Caribbean transits through submarine cable systems landing on Florida’s shores. That strategic position creates a fundamentally different demand profile than domestic-compute-driven markets, one anchored in international connectivity, peering, and network aggregation.
Miami-Dade County currently has at least 50 MW of active data center capacity and 31 MW in planned or under-construction pipeline — a relatively modest figure by national standards, but one that reflects the market’s nature as a connectivity hub rather than a compute warehouse. The county is in the 97th percentile of all U.S. counties for active data centers, driven overwhelmingly by the value of its international network position rather than land cost or power arbitrage.
The distinction matters for buyers: organizations deploying in Miami are primarily doing so to access the subsea cable ecosystem, peer with Latin American and Caribbean networks, reduce latency for customers in those regions, or establish a gateway for traffic entering and leaving the Americas. These are connectivity-first decisions, not compute-first ones. That makes the carrier density of a given facility — and its proximity to the cable landing ecosystem — the primary selection criterion.
Miami’s connectivity position is exceptional and largely irreplaceable. Florida has 17 active submarine cable landing sites with 7 more in development, connecting to landing points in Panama, Honduras, Venezuela, Brazil, the Caribbean, and beyond. The subsea systems serving these routes include the Americas-II system, ARCOS-1, SAm-1, and the MAYA1.2 upgrade — which doubled ring design capacity to 4 Tbps across three landing points and completed in early 2026. These cables collectively carry the preponderance of internet traffic between North America and the 600+ million people in Latin America and the Caribbean.
This infrastructure makes Miami one of the top five most-connected cities in the world for international traffic. For network operators, content delivery networks, financial institutions with Latin American operations, and enterprises serving the region, there is no functional alternative to a Miami presence. The latency and routing economics of transiting traffic through any other U.S. city and then to Latin America simply do not compare.
In July 2025, T-Mobile completed a $2 billion Florida network expansion, deploying 361 new sites in Miami alone and achieving nearly 100% 5G population coverage with average speeds of 266.7 MB/s. Miami’s wireless infrastructure investment reinforces the metro’s position as a regional connectivity anchor.
Miami’s data center market is served by a set of established facilities concentrated in the Brickell/downtown core and the Doral/Sweetwater corridor near Miami International Airport. The NAP of the Americas — a 750,000 sq ft, Category 5-rated landmark in downtown Miami — remains the primary carrier hotel and international exchange point for traffic between the U.S. and Latin America, hosting 160 network carriers connecting to over 150 countries. The broader market includes carrier-dense facilities in the urban core and purpose-built colocation campuses in the northwest suburbs.
New supply is arriving but remains modest relative to national hyperscale markets. Iron Mountain’s MIA-1 facility — a 150,000 sq ft, 16 MW purpose-built campus in Miami’s Westview district — is expected to come online in 2026. At the small end of the spectrum, a glass-enclosed micro-data center dubbed the ‘Fish Bowl’ was proposed in South Miami-Dade in March 2026 to serve small businesses and healthcare providers. Larger-scale ambitions are more contentious: a 3.69 million sq ft hyperscale campus proposed in Loxahatchee (Palm Beach County) has drawn over 8,000 resident signatures in opposition and a Palm Beach County Commission vote pending.
Key takeaway: Miami’s colocation market is not supply-constrained in the same way as Atlanta or Phoenix. The market is shaped more by the scarcity of carrier-dense, subsea-cable-proximate capacity than by raw megawatt shortages. For buyers whose requirements are driven by international connectivity, the relevant question is not ‘is there space’ but ‘is there the right carrier ecosystem and cable access in the right facility.’
Florida Power & Light (FPL) is the primary utility serving Miami-Dade and is one of the more cost-competitive utilities in the Southeast. FPL’s rates run approximately 7.8% below the Florida state average and 26.1% below the national average. On January 1, 2026, a new FPL rate plan took effect, dedicating $945 million in annual revenue to grid hardening and infrastructure resilience — a meaningful investment in the reliability of the power supply serving Miami’s data centers.
The trade-off is Miami’s climate exposure. The county sits within FEMA’s projected flood risk zones, and average time to power for new energy projects in Miami-Dade runs approximately 10 years 5 months — by far the longest of any Radius DC market — reflecting the complexity of permitting and grid interconnection in a dense coastal county. For buyers evaluating existing, fully powered facilities, this timeline is irrelevant. For those planning new-build deployments, it is a material constraint.
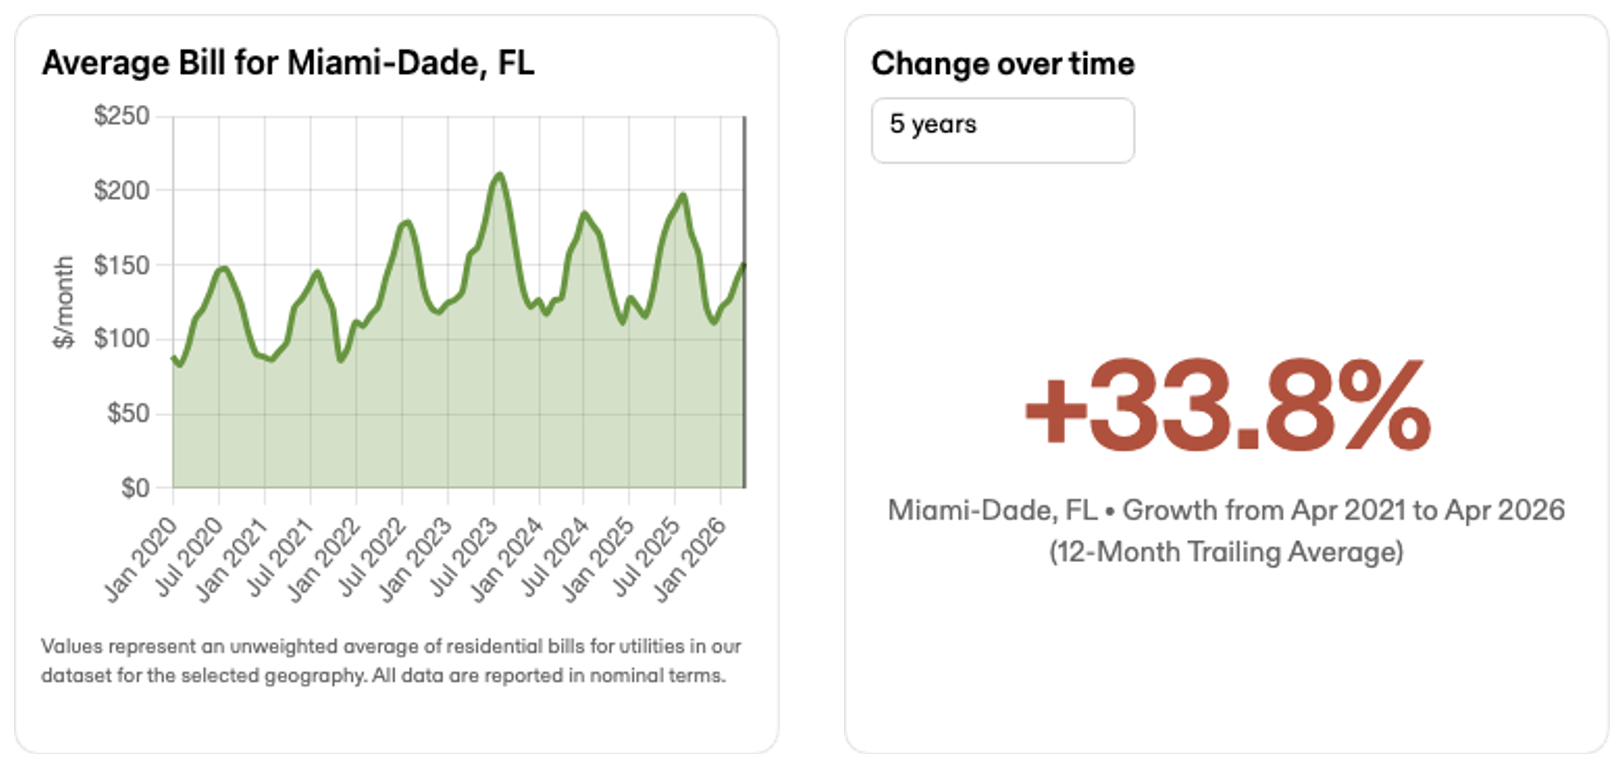
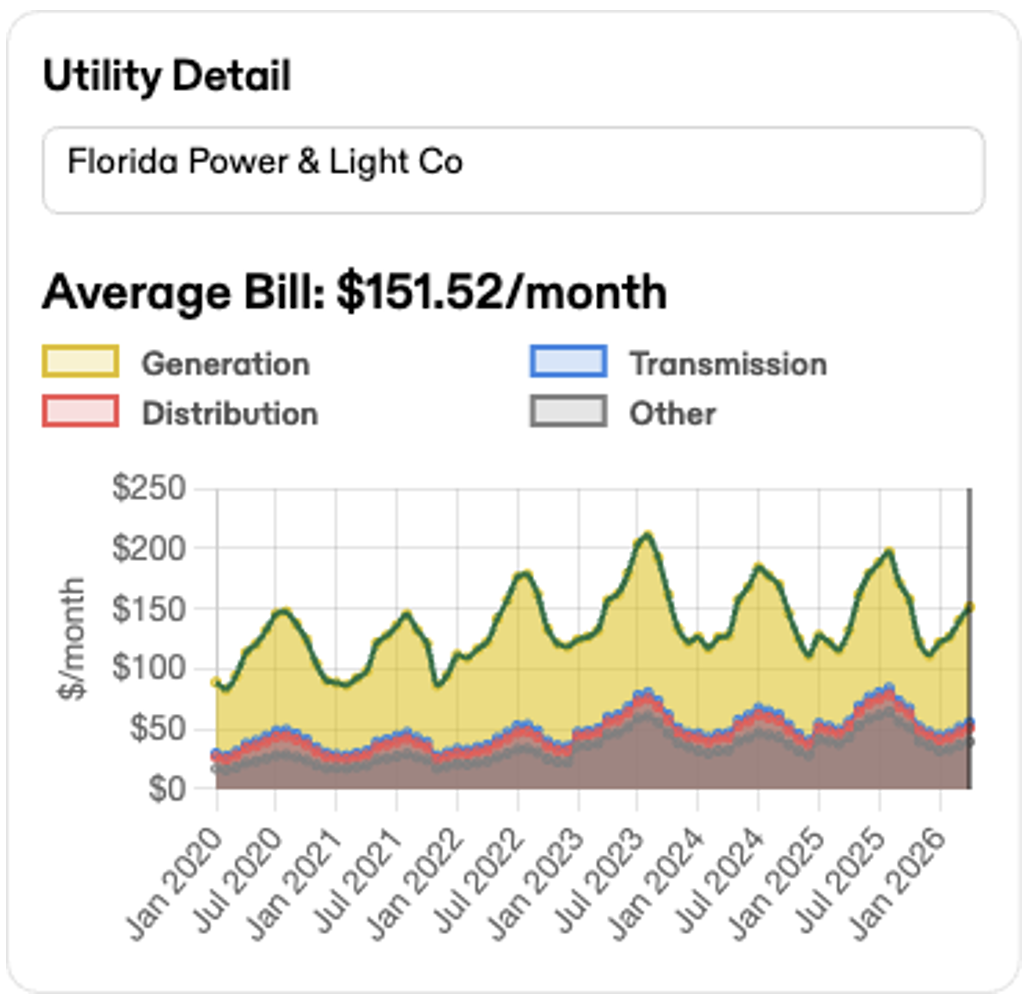
The charts below illustrate electricity cost trends for Miami-Dade (Florida Power & Light service area). Average bills have grown +33.8% over the five years ending April 2026 — the highest rate increase of any Radius DC market — reflecting both population growth and extreme summer cooling demand. The FPL utility detail shows generation as the dominant cost component, with meaningful seasonality in summer months.
FPL utility cost breakdown (generation, transmission, distribution):
Florida offers a meaningful tax incentive package for data center operators and their tenants. The state provides a sales tax exemption on qualifying data center equipment purchases, extended through June 30, 2027. FPL also offers electricity sales tax exemptions to make data center operations more attractive. Florida has no state income tax, which further reduces the cost of operating corporate infrastructure in the state.
For colocation tenants, the equipment tax exemption is worth evaluating with your tax and legal advisors, particularly for deployments involving significant hardware investment. The 2027 sunset means organizations planning multi-year deployments should understand the exemption timeline relative to their equipment procurement schedule.
Miami-Dade County has not enacted data center moratoria or restrictive ordinances of the type seen in Denver or Atlanta’s suburbs. The risk report for Miami-Dade shows no contested data center projects and no data center-specific moratoriums — a notably cleaner regulatory environment than most other markets in this series. Community opposition in South Florida is concentrated around larger exurban projects in outer counties; the Miami-Dade urban and suburban data center market has seen relatively little resistance.
The primary physical risk profile in Miami is distinct from other markets. Miami-Dade County carries elevated exposure to projected flood risk, wildfire risk (in outlying areas), and building loss from storms. The county has 71% protected land coverage and significant critical habitat — constraints that affect development siting more than operations at existing facilities. Water stress is rated Medium-High with Low-Medium depletion — more manageable than Phoenix but a real planning consideration for water-cooled facilities.
For buyers evaluating established facilities, the relevant consideration is infrastructure hardening. Miami’s data center ecosystem has evolved specifically to address the market’s climate exposure: facilities built to CAT5 hurricane standards, located outside the 500-year flood plain and Miami-Dade hurricane evacuation zones, with robust on-site generation and fuel reserves. These are not optional features in Miami — they are baseline requirements of a credible facility.
Miami’s case is straightforward for the right buyer:
Jaymie Scotto & Associates (JSA)

.png)